Drought Analysis with SSI
SynHydro provides the Standardized Streamflow Index (SSI) for characterizing drought from streamflow data. This tutorial covers the SSI calculation and drought event extraction workflow.
Calculate SSI on observed data
SSI transforms raw flows into standardized anomalies by fitting a probability distribution within a rolling window. Values below -1 indicate drought; below -2 is extreme.
import synhydro

Q_daily = synhydro.load_example_data()
Q_monthly = Q_daily.resample("MS").sum()
site = Q_monthly.columns[0]

ssi_calc = synhydro.SSI(dist="gamma", timescale=12, fit_freq="ME")
ssi_calc.fit(Q_monthly[site])
ssi = ssi_calc.get_training_ssi()

print(f"SSI mean: {ssi.mean():.3f}")   # ~0
print(f"SSI std:  {ssi.std():.3f}")     # ~1
Extract drought events
get_drought_metrics identifies contiguous periods where SSI stays below -1:
metrics = synhydro.get_drought_metrics(ssi)
print(metrics[["start", "end", "duration", "severity", "avg_severity"]].head())
Each row is a drought event with its duration, severity (minimum SSI), and magnitude (cumulative deficit).
Visualize ensemble SSI
plot_ssi_timeseries computes SSI for each ensemble realization and overlays
the observed SSI, making it easy to compare synthetic and historical drought
behavior. Pass the ensemble (not a training SSI series) along with the
observed flows.
from synhydro.plotting import plot_ssi_timeseries

gen = synhydro.KirschGenerator()
gen.fit(Q_monthly)
ensemble = gen.generate(n_realizations=20, n_years=20, seed=42)

fig, ax = plot_ssi_timeseries(
    ensemble,
    observed=Q_monthly[site],
    site=site,
    window=12,
    title=f"SSI-12 -- {site}",
)
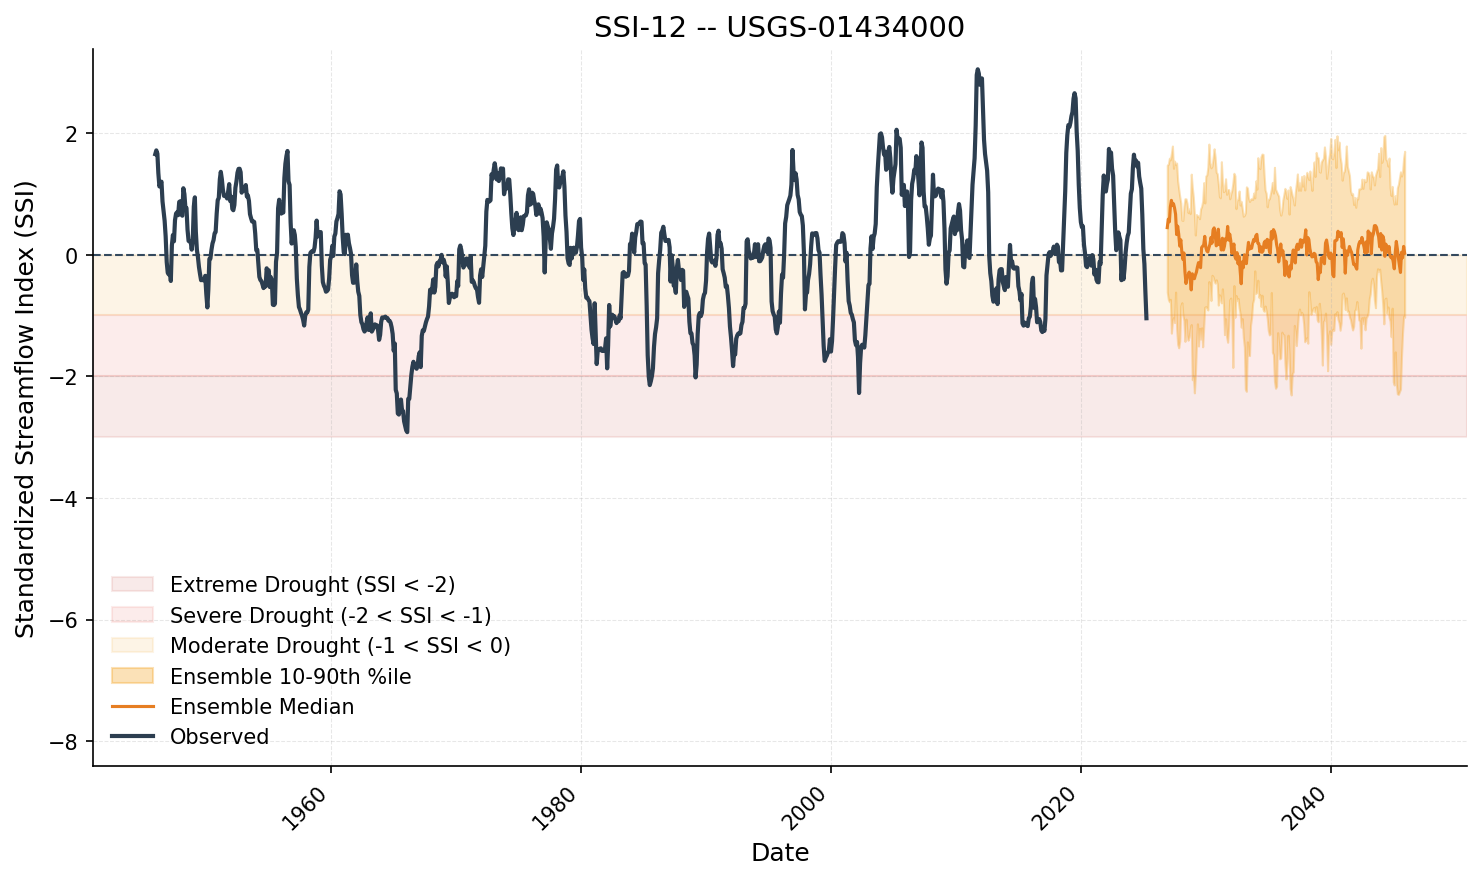
Shaded zones mark moderate (-1 to -1.5), severe (-1.5 to -2), and extreme (< -2) drought conditions.
Choosing a distribution
Use compare_distributions to rank candidate distributions by AIC and
Kolmogorov-Smirnov test:
Next steps
- Ensemble validation - Tutorial 05
- Algorithm details - Kirsch Bootstrap
Previous: Monthly-to-Daily Pipeline | Next: Ensemble Validation